# Returns Insights
## Overview
Specific reports on your returns offering are available in the space.vars.Report\_ReturnsInsights dashboard.
You can use the reports and advanced filters available to review your returns processes, including return rates, common return reasons, and allowing you to track the origin of returns by country or shop and the time it takes for items to return to the warehouse. The report also enables comparison of forecasted return volumes by carrier, highlighting any anomalies based on historical data and threshold metrics.
## Purpose of the Reports
This section provides some example questions and how specific reports can help you answer them to give insights into your data.
An example question is: *What is the usual lifecycle of returns?*
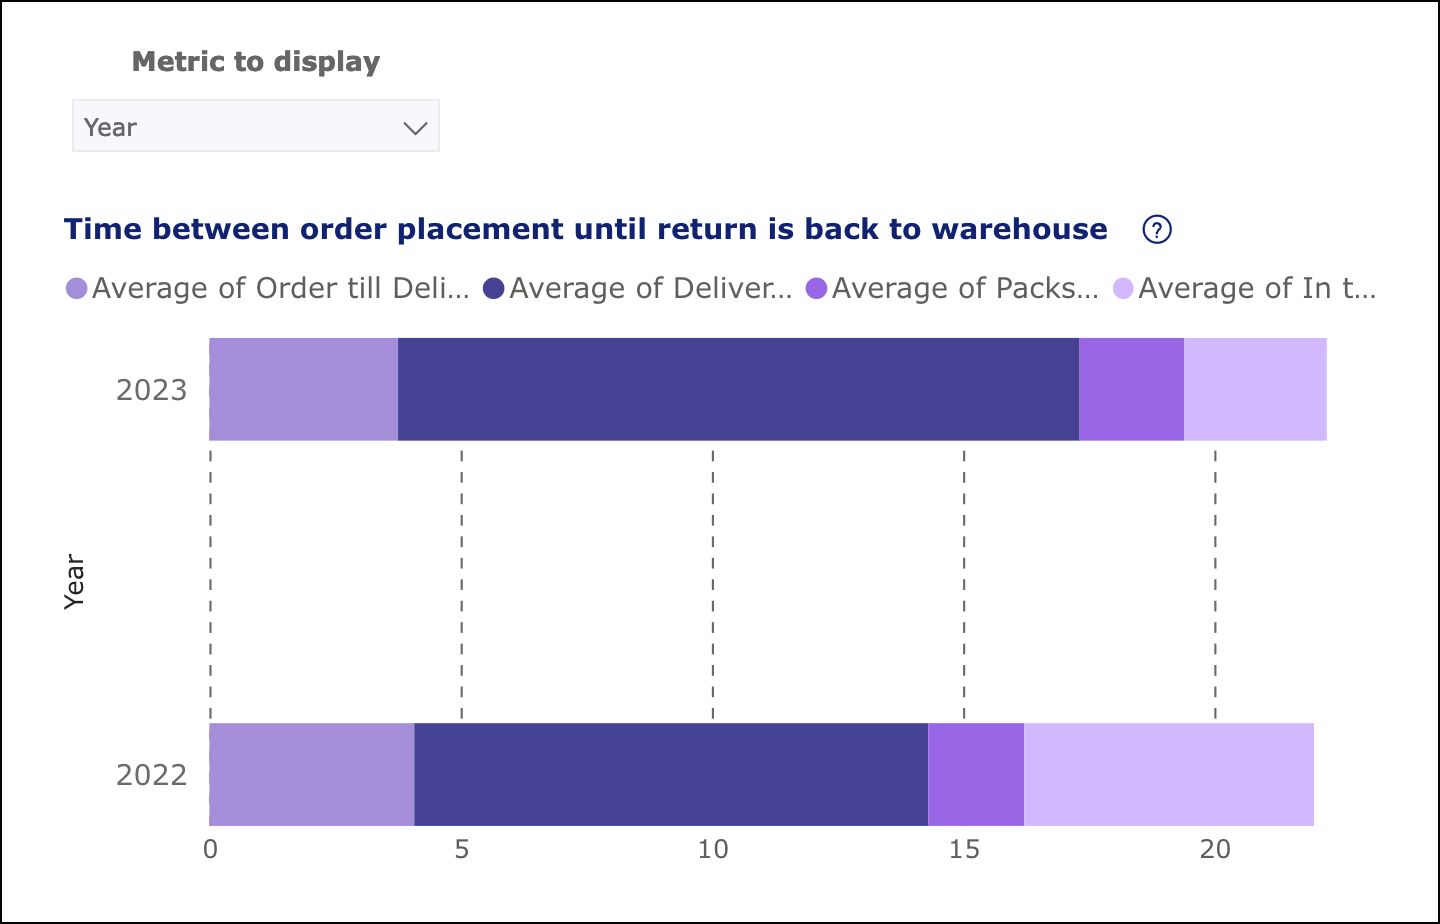
This can be answered by going to the [Network Monitoring report](https://docs.parcellab.com/docs/retain/returns-insights/network-monitoring-report) and viewing the “Time between order placement until return is back to warehouse” graph. With this report, you receive a weekly overview of the days it takes a person to decide to return after the order has been received. You can also identify how many days the carrier takes to send it back to the warehouse once they have dropped the return package at a parcel shop or store. By using the filter above the graph, you can compare the time taken by shop, country or region.
## space.vars.Report\_ReturnsInsights Reports
Each of the reports in the space.vars.Report\_ReturnsInsights dashboard are described in the following pages.
{% content-ref url="returns-insights/shopify-returns-report" %}
[shopify-returns-report](https://docs.parcellab.com/docs/retain/returns-insights/shopify-returns-report)
{% endcontent-ref %}
{% content-ref url="returns-insights/shopify-product-returns-report" %}
[shopify-product-returns-report](https://docs.parcellab.com/docs/retain/returns-insights/shopify-product-returns-report)
{% endcontent-ref %}
{% content-ref url="returns-insights/network-monitoring-report" %}
[network-monitoring-report](https://docs.parcellab.com/docs/retain/returns-insights/network-monitoring-report)
{% endcontent-ref %}
{% content-ref url="returns-insights/item-insights-report" %}
[item-insights-report](https://docs.parcellab.com/docs/retain/returns-insights/item-insights-report)
{% endcontent-ref %}
{% content-ref url="returns-insights/registrations-report" %}
[registrations-report](https://docs.parcellab.com/docs/retain/returns-insights/registrations-report)
{% endcontent-ref %}
{% hint style="info" icon="book" %}
#### Check out the parcelLab guides
For further information on using the dashboard and metrics, see our [user guide documentation](https://how.parcellab.works/guides/returns/returns-insights).
{% endhint %}
---
# Agent Instructions: Querying This Documentation
If you need additional information that is not directly available in this page, you can query the documentation dynamically by asking a question.
Perform an HTTP GET request on the current page URL with the `ask` query parameter:
```
GET https://docs.parcellab.com/docs/retain/returns-insights.md?ask=
```
The question should be specific, self-contained, and written in natural language.
The response will contain a direct answer to the question and relevant excerpts and sources from the documentation.
Use this mechanism when the answer is not explicitly present in the current page, you need clarification or additional context, or you want to retrieve related documentation sections.